Using the Gantt Chart in Boost.spaceA platform that centralizes and synchronizes company data from internal and external sources, offering a suite of modules and addons for project management, CRM, data visualization, and more. Has many features to optimize your workflow! Tasks ModuleOne of the modules of the Boost.space system. In this module, you can easily manage your business tasks.
Utilizing the Gantt Chart Feature in Boost.space’s Tasks Modulea module is an application or tool designed to handle specific business functions, such as CRM, project management, or inventory. The system's modular architecture allows you to activate only the modules you need, enabling customization and scalability as your business requirements evolve.
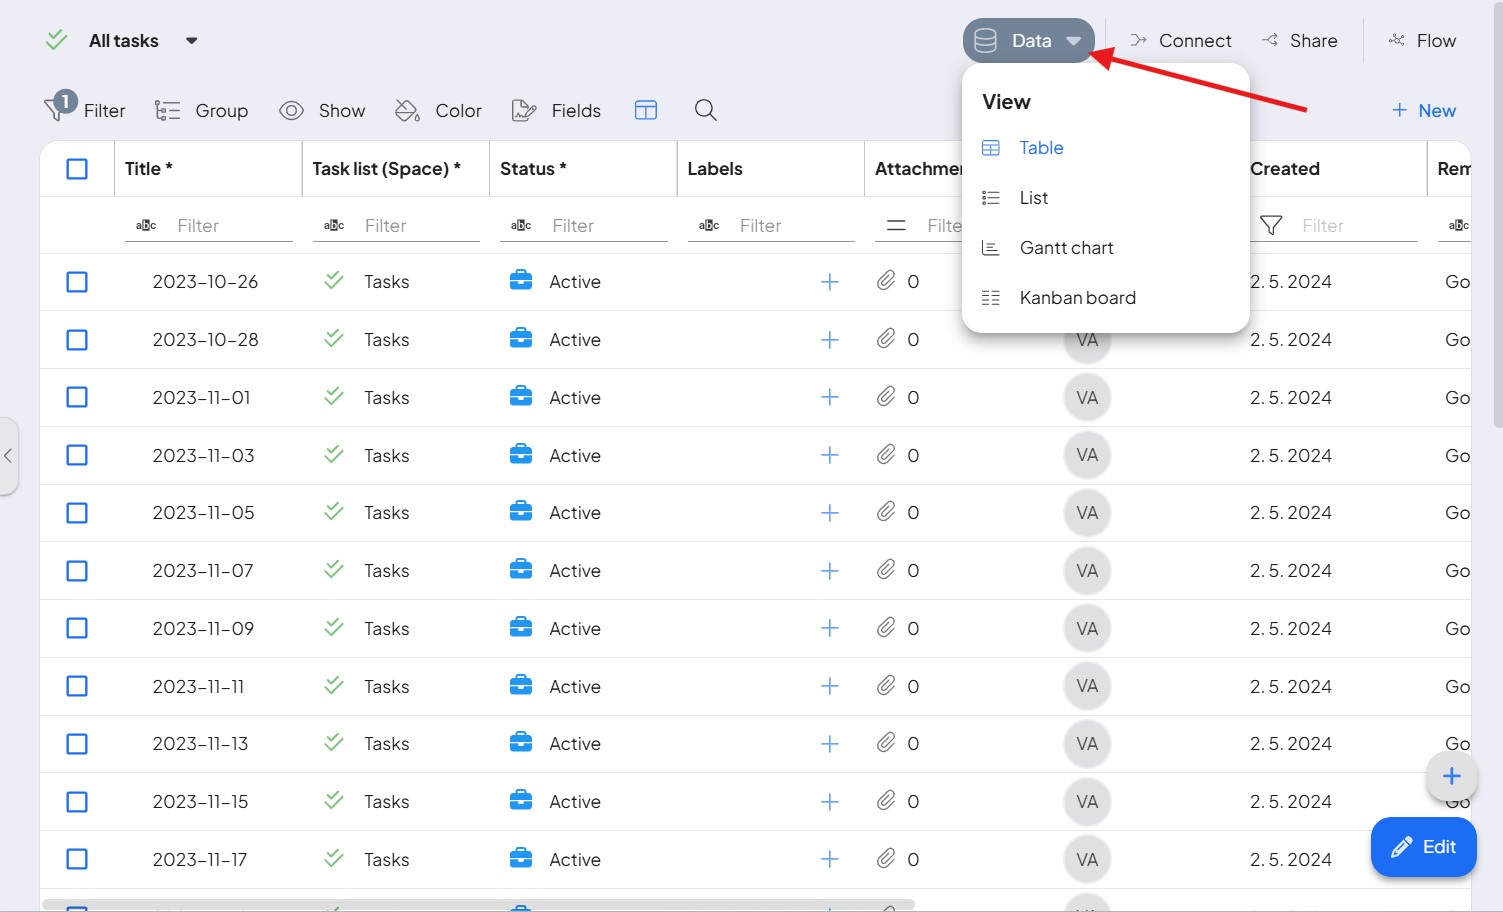
The Gantt chart is another view available in the Tasks module that helps you keep track of progress on tasks. You can find this view after clicking on the arrow icon under the Data section at the top of your screen.

This view presents tasks as a timeline, allowing for easy identification of task dependencies and easy adjustments of deadlines. The Gantt chart supports the effective distribution of tasks among employees, which is the foundation of successful project management. It allows all usersCan use the system on a limited basis based on the rights assigned by the admin. to display the planned tasks and workload of the team as well as individual employees.
Like the Kanban Board, the Gantt chart is also integrated with other Boost.space modulesa module is an application or tool designed to handle specific business functions, such as CRM, project management, or inventory. The system's modular architecture allows you to activate only the modules you need, enabling customization and scalability as your business requirements evolve., like Projects and Work reports. It supports cooperation within a team and allows for an easy overview of changes and comments.