The Plotly modules allow you to create, update, and/or delete graphs in your Plotly account.
Prerequisites
-
A Plotly account
In order to use Plotly with Boost.space Integrator, it is necessary to have a Plotly account. If you do not have one, you can create a Plotly account at https://chart-studio.plot.ly/Auth/login/?action=signup#/.
![[Note]](https://docs.boost.space/wp-content/themes/bsdocs/docs-parser/HTML/css/image/note.png) |
Note |
|---|---|
|
The module dialog fields that are displayed in bold (in the Boost.space Integrator scenario, not in this documentation article) are mandatory! |
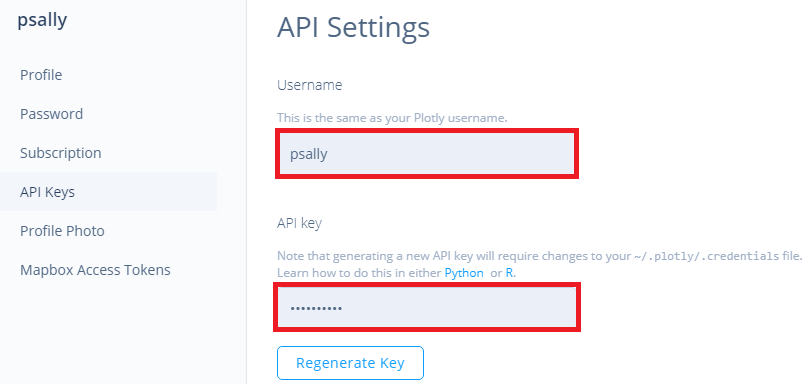
To connect your Plotly account to Boost.space Integrator, you need to obtain your Username and API Key.
1. Log into your Plotly Account.
2. Click the Profile icon ->Settings ->API Keys.
3. Copy the Username and API Key.
4. Go to Boost.space Integrator and open the Plotly module’s Create a connection dialog.
5. Enter the Username and API Key you copied in step 3.
6. Click Continue.
The Connection has been established.
Creates a new Plotly graph.
|
Connection |
|
|
File Name |
Enter the graph name. |
|
File Options |
Select the file options for the graph:
|
|
Graph Type |
Select the type of graph you want to create:
|
|
X Axis Title |
Enter a name for X-Axis. |
|
X Axis Type |
Select the X-Axis type:
|
|
Y-Axis Title |
Enter a name for Y-Axis. |
|
Y Axis Type |
Select the Y-Axis type:
|
Deletes an existing graph.
|
Connection |
|
|
Graph ID |
Select the Graph ID you want to delete. |
Creates a graph image based on specified parameters.
|
Connection |
|
|
Format of the graph figure you want to generate |
Select the format of the graph image you want to create:
|
|
Figure Width |
Enter the image width in pixels. |
|
Figure Height |
Enter the image height in pixels |
|
Graph Type |
Select the type of graph you want to create:
|
|
X Axis Title |
Enter a name for X-Axis. |
|
X Axis Type |
Select the X-Axis type:
|
|
Y Axis Title |
Enter a name for X-Axis. |
|
Y Axis Type |
Select the Y-Axis type:
|