| Active with remarks |
|---|
| This application needs additional settings. Please follow the documentation below to create your own connection. |
The Datadog modules enable you to post time-series data that can be graphed on Datadog’s dashboards or make a custom API call.
Prerequisites
-
A Datadog account
In order to use Datadog with Boost.space Integrator, it is necessary to have a Datadog account. If you do not have one, you can create a Datadog account at www.datadoghq.com.
![[Note]](https://docs.boost.space/wp-content/themes/bsdocs/docs-parser/HTML/css/image/note.png) |
Note |
|---|---|
|
The module dialog fields that are displayed in bold (in the Boost.space Integrator scenario, not in this documentation article) are mandatory! |
To connect your Datadog account to Boost.space Integrator you need to retrieve an API Key from your Datadog account.
-
Log in to your Datadog account.
-
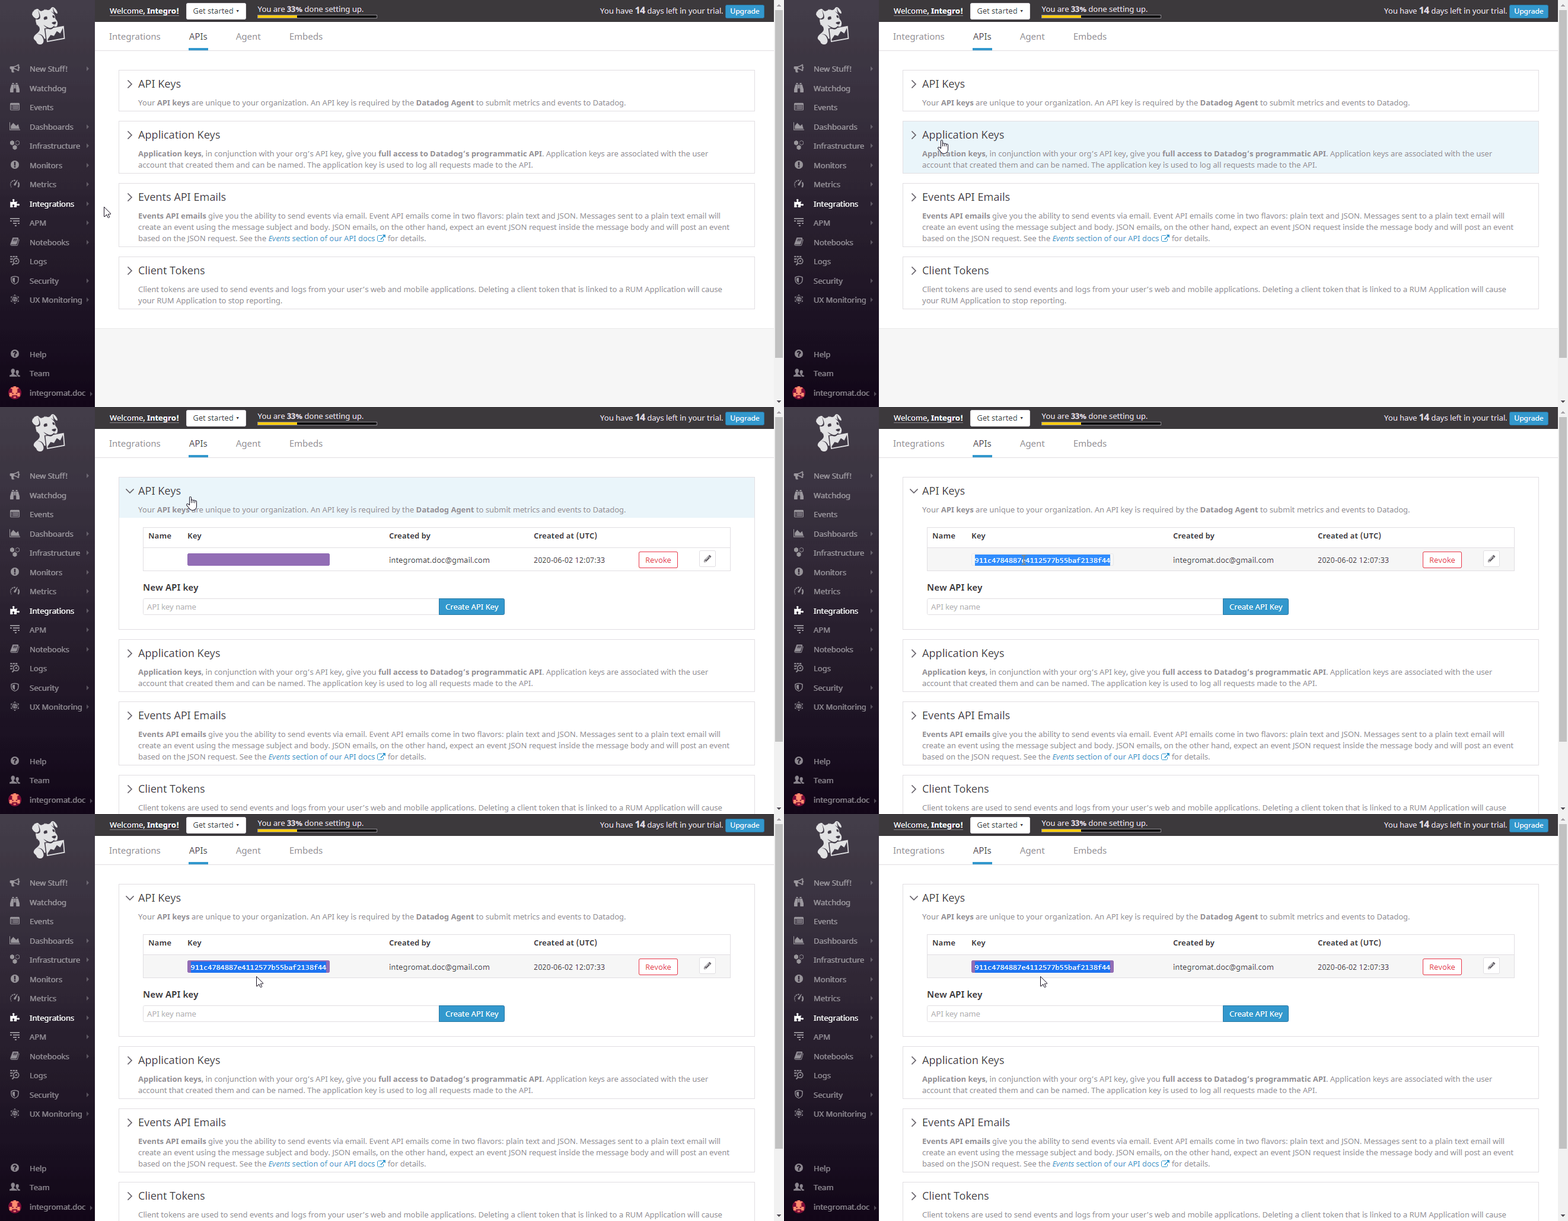
In the menu on the left, open Integrations > APIs.
-
Click the API Keys option and then copy the provided API Key (point the mouse over the rectangle in the Key column to unhide your API Key).
-
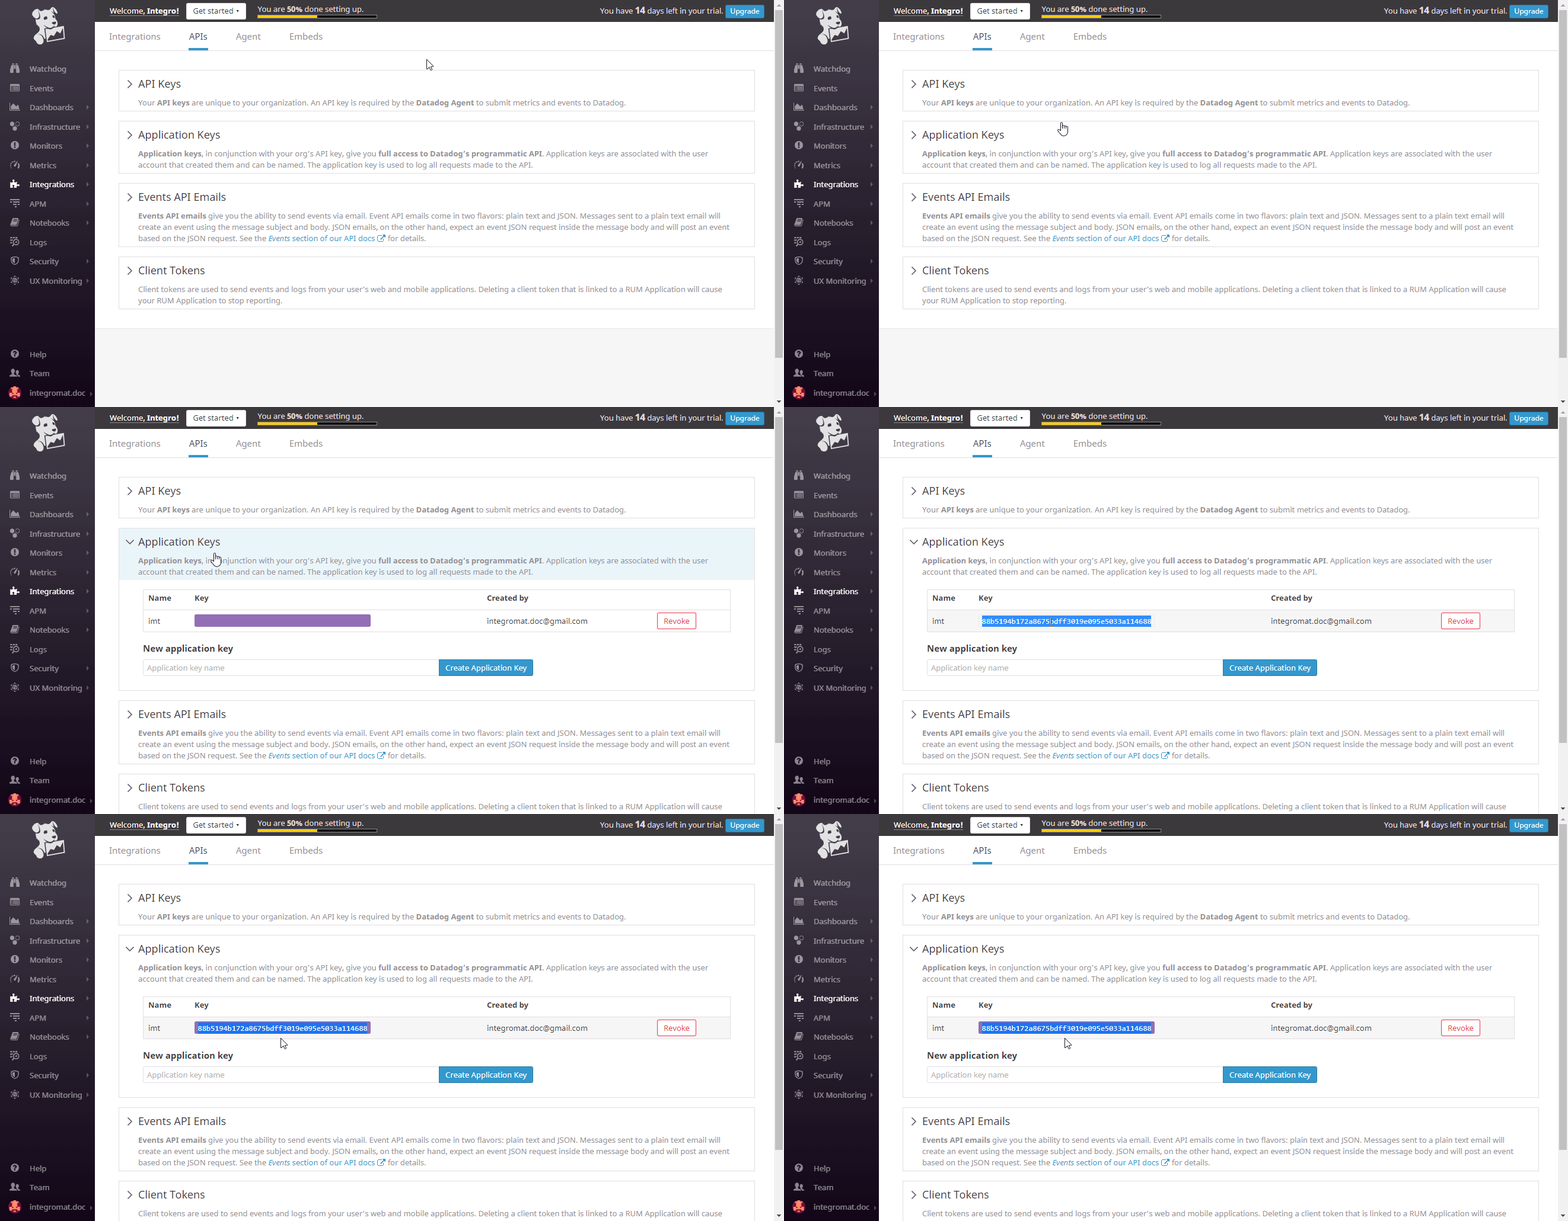
Repeat the same for the Application Keys option to retrieve the Application Key.
-
Go to Boost.space Integrator and open the Datadog module’s Create a connection dialog.
Fill the module’s fields as follows:
Connection Type
Select the Datadog Application option to get full access to Datadog API.
Connection Name
Enter the desired name for the connection.
Domain
Select your domain (US site or EU site).
API Key
Enter the API Key you have copied in step 3 (above).
Application Key
Enter the Application Key you have copied in step 4 (above).
-
To the respective field and click the Continue button to establish the connection.
The connection has been established. You can proceed with setting up the module.
The module allows you to post time-series data that can be graphed on Datadog’s dashboards. The limit for compressed payloads is 3.2 megabytes (3200000), and 62 megabytes (62914560) for decompressed payloads.
|
Connection |
|||||||||||
|
Series |
Add time series you want to submit to Datadog.
|
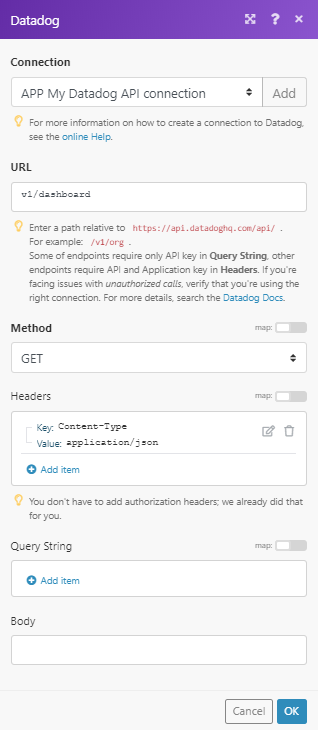
Allows you to perform a custom API call.
|
Connection |
||||
|
URL |
Enter a path relative to
|
|||
|
Method |
Select the HTTP method you want to use: GET to retrieve information for an entry. POST to create a new entry. PUT to update/replace an existing entry. PATCH to make a partial entry update. DELETE to delete an entry. |
|||
|
Headers |
Enter the desired request headers. You don’t have to add authorization headers; we already did that for you. |
|||
|
Query String |
Enter the request query string. |
|||
|
Body |
Enter the body content for your API call. |


